Work with a table in DataBox FileMaker’s plugin
Introduction
On this page, we show several examples for understanding DataBox work. We’ll create a simple dataset, manipulate it and get the result in several formats.
Creating simple table
Here we create a simple dataset as a table with five columns. Then we add rows. Usually, data is an SQL request result, but we can also define it manually. We use space as a separator for columns and ¶ as a separator for rows.
Let ([

res = DB_NewDataSetAsTable( "SimpleTable" ; "num;fname;product;date;price" ; "number;text;text;date;number" ; 1 ) ;

res = DB_AddRows ( "SimpleTable" ;

"1 Мaria Asus 2020-12-17 300.25¶2 Scarlet iPad 2020-02-15 120¶3 Keira Monitor 2020-03-04 230.50¶4 Keira iPhone 2020-04-05 400¶5 Мaria iPhone 2021-01-11 380¶6 Мaria iPad 2021-03-12 250.90¶7 Scarlet iPad 2020-11-07 600.30¶8 Charlize Asus 2020-02-15 150.40" ;

"¶" ; " " ; 0; "YYYY-MM-DD" )

];

res

)
The result of this calculation will be OK. But in memory a new dataset was created with “SimpleTable” name.
Getting as dataset
DB_GetDataSet( "SimpleTable" )The result of this function looks like this.
[1]num
1 2 3 4 5 6 7 8

[2]fname
Мaria Scarlet Keira Keira Мaria Мaria Scarlet Charlize

[3]product
Asus iPad Monitor iPhone iPhone iPad iPad Asus

[4]date
2020-12-17 2020-02-15 2020-03-04 2020-04-05 2021-01-11 2021-03-12 2020-11-07 2020-02-15

[5]price
300.25 120 230.5 400 380 250.9 600.3 150.4
Getting as text table
We can take a look at our dataset as a table.
DB_GetDataSetAsTextTable ( "SimpleTable" )By default the Databox uses a tab symbol for the columns separator and ¶ for the rows separator.
1   Мaria   Asus    2020-12-17  300.25
2   Scarlet iPad    2020-02-15  120
3   Keira   Monitor 2020-03-04  230.5
4   Keira   iPhone  2020-04-05  400
5   Мaria   iPhone  2021-01-11  380
6   Мaria   iPad    2021-03-12  250.9
7   Scarlet iPad    2020-11-07  600.3
8   Charlize    Asus    2020-02-15  150.4
But we can use any other symbol. Also, we can set a range.
DB_GetDataSetAsTextTable ( "SimpleTable" ; ¶ ; "##"; 1 ; "num;product;price" ; 1 ; 5; )num##product##price##
1##Asus##300.25
2##iPad##120
3##Monitor##230.5
4##iPhone##400
5##iPhone##380Getting as simple HTML table
We can get our dataset as a ready to use HTML page.
DB_GetDataSetAsHTMLtTable ( "SimpleTable" ; "" )Without any options, our table will look like this 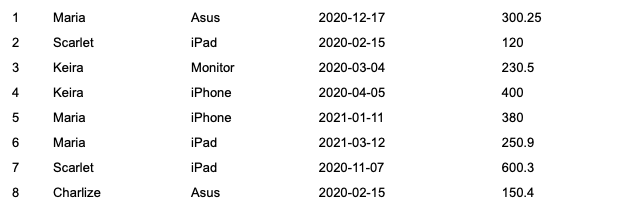
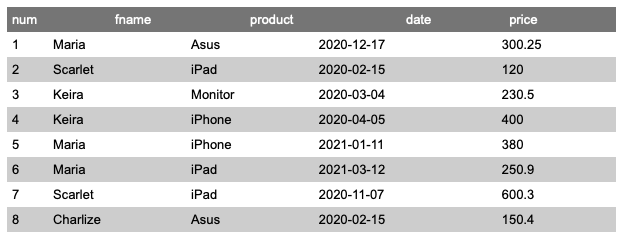
Let’s make our table a little prettier. We can turn on the header and set the style for it, odd and even rows.
DB_GetDataSetAsHTMLtTable ( "SimpleTable" ;
"
header = 'on';
header_class = 'background-color: gray;  ';

row_class_odd = ' background-color: white;  color: black; ';
row_class_even = ' background-color: lightgrey; color: black; ';

"
)
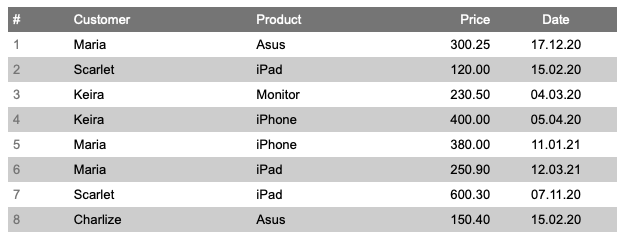
Let’s give it more individuality. We can set an alternative column name and order. Then we can set our own width, style and formats for each column.
DB_GetDataSetAsHTMLtTable ( "SimpleTable" ;
"
header = 'on';
header_class = 'background-color: gray;  ';

row_class_odd = ' background-color: white;  color: black; ';
row_class_even = ' background-color: lightgrey; color: black; ';

columns.1 = 'num';
columns.1.prettyname = '#';
columns.1.width = '10%';
columns.1.class = 'color: gray; font-size: 10pt;';

columns.2 = 'fname';
columns.2.prettyname = 'Customer';
columns.2.width = '30%';

columns.3 = 'product';
columns.3.prettyname = 'Product ';
columns.3.width = '20%';

columns.4 = 'price';
columns.4.prettyname = 'Price ';
columns.4.width = '20%';
columns.4.format = '%.2f';
columns.4.class_header = 'text-align: right; ';
columns.4.class = 'text-align: right; ';

columns.5 = 'date';
columns.5.prettyname = 'Date ';
columns.5.width = '20%';
columns.5.format = 'DD.MM.YY';
columns.5.class_header = 'text-align: center; ';
columns.5.class = 'text-align: center; ';

"
)
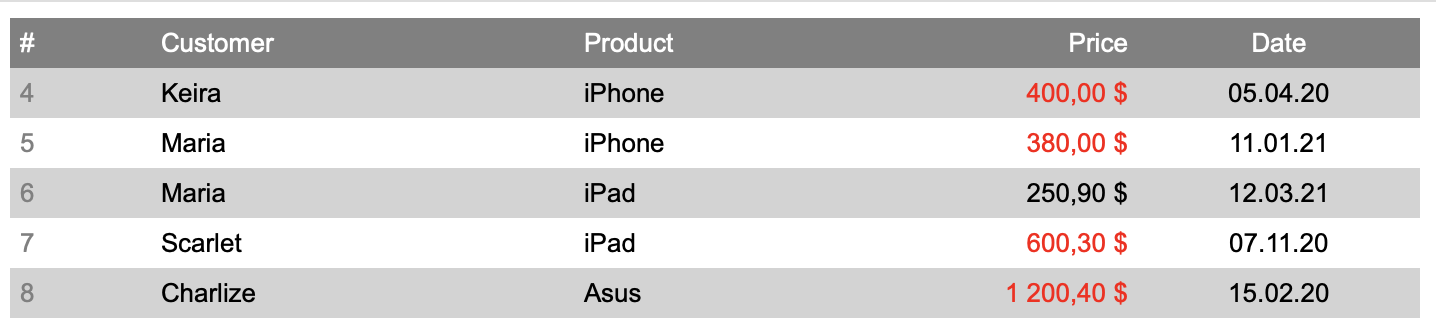
For numeric format, we used the expression ‘%.2f’. We can use any expression correct for the C language printf function (see here for details). But we can get more control for each cell with the use of the cond_function parameter. This parameter set JavaScript function will be executed each time when the browser (the FileMaker Webviwer) renders the cell of our table. All our javascript code passes to DB_GetDataSetAsHTMLtTable in special parameter. The function defined in cond_function always has one parameter. It’s an HTML element of the cell, which is beeing rendered during this time. So we can change innerHTML, style and use any javascript functionality.
Here we set red colour for values more than 300. Also, we use javascript numberFormat() function for formatting numeric values. DataBox always inserts numberFormat() functions in HTML table, so we can use it. This function allows us to set thousand separator, currency symbol, round precision and decimal sign. The function signature looks like numberFormat( num, sep, curr, round, decimal)
DB_GetDataSetAsHTMLtTable ( "SimpleTable" ;
"
header = 'on';
header_class = 'background-color: gray; ';
row_class_odd = ' background-color: white; color: black; ';
row_class_even = ' background-color: lightgrey; color: black; ';
columns.1 = 'num';
columns.1.prettyname = '#';
columns.1.width = '10%';
columns.1.class = 'color: gray; font-size: 10pt;';
columns.2 = 'fname';
columns.2.prettyname = 'Customer';
columns.2.width = '30%';
columns.3 = 'product';
columns.3.prettyname = 'Product ';
columns.3.width = '20%';
columns.4 = 'price';
columns.4.prettyname = 'Price ';
columns.4.width = '20%';
columns.4.format = '%.2f';
columns.4.class_header = 'text-align: right; ';
columns.4.class = 'text-align: right; ';
columns.4.cond_function = 'mycond';
columns.5 = 'date';
columns.5.prettyname = 'Date ';
columns.5.width = '20%';
columns.5.format = 'DD.MM.YY';
columns.5.class_header = 'text-align: center; ';
columns.5.class = 'text-align: center; ';
" ; 4 ; DB_Lenght( "SimpleTable$num" );
"
function mycond(elem) {
var value = elem.innerHTML;
if (value == 150.40) value = 1200.40; 
if ( value > 300 ) elem.style.color = 'red';
elem.innerHTML = numberFormat (value, ' ', ' $', 2, ',');
}
"
)
In this example, we also set the output range of our table from 4th row to the end. And we especially change the last value for demonstrating thousand separator.
Grouping and summarizing the table
Now we’ll try to group our table by name of a customer. Preliminary we can sort table by name.
Let ( [

res = DB_Sort ( "SimpleTable" ; 1 ; "fname" );
res = DB_Group ( "SimpleTable" ; "fname" ; "GroupTable")
];

DB_GetDataSet( "GroupTable" )

)
Now we have new dataset “GroupTable”. Function DB_GetDataSet shows how it looks.
[1]fname
Charlize Keira Scarlet Мaria

[2]Details

[1]R1

[1]num
8
[2]fname
Charlize
[3]product
Asus
[4]date
2020-02-15
[5]price
150.4
[2]R2

[1]num
4 3
[2]fname
Keira Keira
[3]product
iPhone Monitor
[4]date
2020-04-05 2020-03-04
[5]price
400 230.5
[3]R3

[1]num
7 2
[2]fname
Scarlet Scarlet
[3]product
iPad iPad
[4]date
2020-11-07 2020-02-15
[5]price
600.3 120
[4]R4

[1]num
6 5 1
[2]fname
Мaria Мaria Мaria
[3]product
iPad iPhone Asus
[4]date
2021-03-12 2021-01-11 2020-12-17
[5]price
250.9 380 300.25
DB_GetDataSet is not the best way to view hierarchical structures, but we can note couple of moments. Our new dataset has two child datasets. The first dataset is the unique vector of columns “fname”. Its name is always the same as the name of the column by which we grouped it. The second dataset always has name “Details”. It is a hierarchical dataset. It has child datasets R1, R2… etc. The quantity of R-datasets equals a quantity of values in “fname” Each R-dataset has the same structure as the source dataset (SimpleTable), where each row (R1,R2…) corresponding to fname value.
For better understanding we can look at our “GroupTable” like JSON
DB_GetDataSetAsJSON ( "GroupTable" ){
"fname": [ "Charlize", "Keira", "Scarlet", "Мaria" ],
"Details": {
"R1": {
"num": 8,
"fname": "Charlize",
"product": "Asus",
"date": "2020-02-15",
"price": 150.4
},
"R2": {
"num": [ 4, 3 ],
"fname": [ "Keira", "Keira" ],
"product": [ "iPhone", "Monitor" ],
"date": [ "2020-04-05", "2020-03-04" ],
"price": [ 400, 230.5 ]
},
"R3": {
"num": [ 7, 2 ],
"fname": [ "Scarlet", "Scarlet" ],
"product": [ "iPad", "iPad" ],
"date": [ "2020-11-07", "2020-02-15" ],
"price": [ 600.3, 120 ]
},
"R4": {
"num": [ 6, 5, 1 ],
"fname": [ "Мaria", "Мaria", "Мaria" ],
"product": [ "iPad", "iPhone", "Asus" ],
"date": [ "2021-03-12", "2021-01-11", "2020-12-17" ],
"price": [ 250.9, 380, 300.25 ]
}
}
})Next step we’ll add the totals by price for each customer.
Let ( [

res = DB_sApply ( "GroupTable$fname" ;
    "DB_Agregate ( 'GroupTable$Details$R_elemidx_$price' ; 'sum'  )"  ;
    "total" ; "number" ) ;

res = DB_MoveDataSet ( "total" ; "GroupTable" ; 1 )
];

DB_GetDataSetAsJSON ( "GroupTable" )
)
In this code, we use the DB_sApply function for creating a new dataset “total” with sum by price for each group. We can think about DB_sApply like a loop, where the amount of step equals the amount of values of the “GroupTable$fname” dataset.
In each step, we use the DB_Agregate function and apply it to values of the “price” dataset of the current row R1, R2, etc. We use the special keyword elemidx for getting the correct path to the dataset in the current step of the loop. GroupTable$Details$R_elemidx_$price gives us “GroupTable$Details$R1$price” in the first step, “GroupTable$Details$R2$price” in the second step, etc.
As a result, we have a new dataset “total” in the memory. And we use the DB_MoveDataSet function to insert it into our grouped dataset “GroupTable”
{
  "fname": [ "Charlize", "Keira", "Scarlet", "Мaria" ],
  "Details": {
    "R1": {
      "num": 8,
      "fname": "Charlize",
      "product": "Asus",
      "date": "2020-02-15",
      "price": 150.4
      },
    "R2": {
      "num": [ 4, 3 ],
      "fname": [ "Keira", "Keira" ],
      "product": [ "iPhone", "Monitor" ],
      "date": [ "2020-04-05", "2020-03-04" ],
      "price": [ 400, 230.5 ]
      },
    "R3": {
      "num": [ 7, 2 ],
      "fname": [ "Scarlet", "Scarlet" ],
      "product": [ "iPad", "iPad" ],
      "date": [ "2020-11-07", "2020-02-15" ],
      "price": [ 600.3, 120 ]
      },
    "R4": {
      "num": [ 6, 5, 1 ],
      "fname": [ "Мaria", "Мaria", "Мaria" ],
      "product": [ "iPad", "iPhone", "Asus" ],
      "date": [ "2021-03-12", "2021-01-11", "2020-12-17" ],
      "price": [ 250.9, 380, 300.25 ]
      }
    },
  "total": [ 150.4, 630.5, 720.3, 931.15 ]
  }
Getting grouped table as HTML
Now we have grouped table with subtotals and we can get it as html-page. First, we use DB_GetDataSetAsHTMLtTable function with couple parameters.
DB_GetDataSetAsHTMLtTable ( "GroupTable" ;
"
header = 'on';
header_class = 'background-color: gray;  ';

row_class_odd = ' background-color: white;  color: black; ';
row_class_even = ' background-color: lightgrey; color: black;  ';

"
 )

Here we can see how the DataBox works with the hierarchical structure when the HTML table is being built. The child dataset is the table in the cell. And we can tune the child table separately from is parent’s table.
Usually we would like to see the child’s table as a body of the table, and the parent’s table as a sub summary part. We can make it with special parameter inlineChildTable. If inlineChildTable is on, the cell with child’s table will move to the next row. Note this cell has to be last cell in the table, otherwise all next cells will be moved with it. So in the next example we set the columns order.
DB_GetDataSetAsHTMLtTable ( "GroupTable" ;
"
header = 'on';
header_class = 'background-color: gray;  ';

row_class_odd = ' background-color: yellow;  color: black; ';
row_class_even = ' background-color: yellow; color: black;  ';

inlineChildTable =  'on' ;

columns.1 = 'fname';
columns.1.prettyname = 'Customer';

columns.2 = 'total';
columns.2.prettyname = 'Price';

columns.3 = 'Details';

"
 )
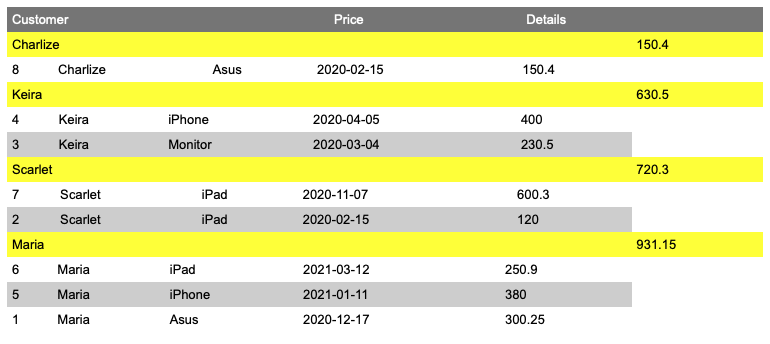
Obviously we have right structure of our table, but we need more formatting and adjustments. Also we turn off the main header and turn on the header for each child’s table for better descriptivness.
DB_GetDataSetAsHTMLtTable ( "GroupTable" ;
"
header = 'off';

row_class_odd = ' background-color: white;  color: black; ';
row_class_even = ' background-color: white; color: black;  ';

inlineChildTable =  'on' ;

columns.1 = 'fname';
columns.1.prettyname = 'Customer';
columns.1.width = '75%';
columns.1.class = 'color: gray; font-size: 12pt; padding-top: 20px; float:left;   ';


columns.2 = 'total';
columns.2.prettyname = 'Price';
columns.2.width = '20%';
columns.2.format = '%.2f';
columns.2.class = 'color: black; font-size: 10pt; padding-top: 24px; text-align: right; float: right;  ';


columns.3 = 'Details';

columns.3.table.header = 'on';
columns.3.table.header_class = 'background-color: gray;  ';

columns.3.table.row_class_odd = ' background-color: white;  color: black; ';
columns.3.table.row_class_even = ' background-color: lightgrey; color: black;  ';

columns.3.table.columns.1 = 'product';
columns.3.table.columns.1.prettyname = 'Product ';
columns.3.table.columns.1.width = '40%';
columns.3.table.columns.1.class = 'float:left;  ';
columns.3.table.columns.1.class_header = ' width: 40%; float:left;   ';


columns.3.table.columns.2 = 'date';
columns.3.table.columns.2.prettyname = 'Date ';
columns.3.table.columns.2.width = '20%';
columns.3.table.columns.2.format = 'DD.MM.YY';
columns.3.table.columns.2.class = 'text-align: center; float:left;     ';
columns.3.table.columns.2.class_header = 'text-align: center; width: 25%;   float:left;    ';

columns.3.table.columns.3 = 'price';
columns.3.table.columns.3.prettyname = 'Price ';
columns.3.table.columns.3.width = '25%';
columns.3.table.columns.3.format = '%.2f';
columns.3.table.columns.3.class = 'text-align: right; float: right;   ';
columns.3.table.columns.3.class_header = 'text-align: right;  width: 25%;  float: right;  ';

"
 )
And as result …
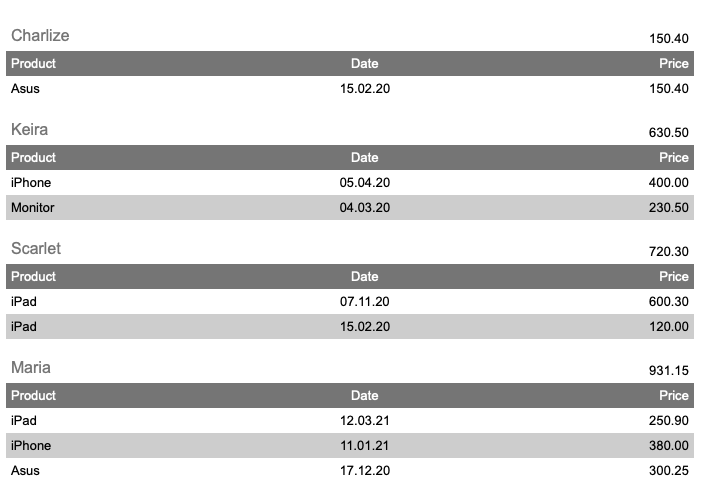
Looks good.
We believe that using DataBox can be a great alternative for creating different reports in the FileMaker. It’s fast, easy, effective and it provides many options for different cases.